Search the Site
Technical Methodology
Throughout my career in the investment management industry, I have covered global asset markets for some of the world’s most respected firms including Fidelity Investments and Wellington Management Company. Specializing in Hedge Fund Portfolio Management, I thrive in environments where I can cull through large amounts of data to generate insights and ideas to identify emerging themes across asset classes.
With strong analytical skills, I dig deep to identify short, intermediate, and long-term investment recommendations that mitigate risk and maximize return. My unique systematic approach to developing custom indicators and indices has led me to deliver a flexible model that reflects true market performance.
At the core of our approach are “Money Flow Units” (MFU), something known to only three other people in the industry. Over the span of the last twenty years, I have enhanced the proprietary model with additional qualifying inputs which has strengthened the money flow units. The MFU measures the capital flow in and out of an asset. Think of these as baskets of capital that are flowing into a stock or an index when bottoming. At some point, the amount of capital flow will overwhelm supply and propel the next leg up forming the MFU targets. Conversely, at highs, a MFU will form and overwhelm demand which will start the downside process.
There are four Money Flow Unit price zones that are projected after the initial low or high is formed. These zones will create either a pause/consolidation, correction or the termination of the previous price direction.
Money Flow Unit 2: The initial area where a counter-trend move takes place giving an opportunity to “buy a pullback” in the case of a bottoming formation.
Money Flow Unit 3 or 4: Depending on the market cycle, large counter trend moves take place or can signal the termination of the prior leg.
Money Flow Unit 5: This occurs about 5% of the time and at extreme market cycles characterized by strong momentum. The last MFU-5 in the S&P 500 occurred in March of 2000.
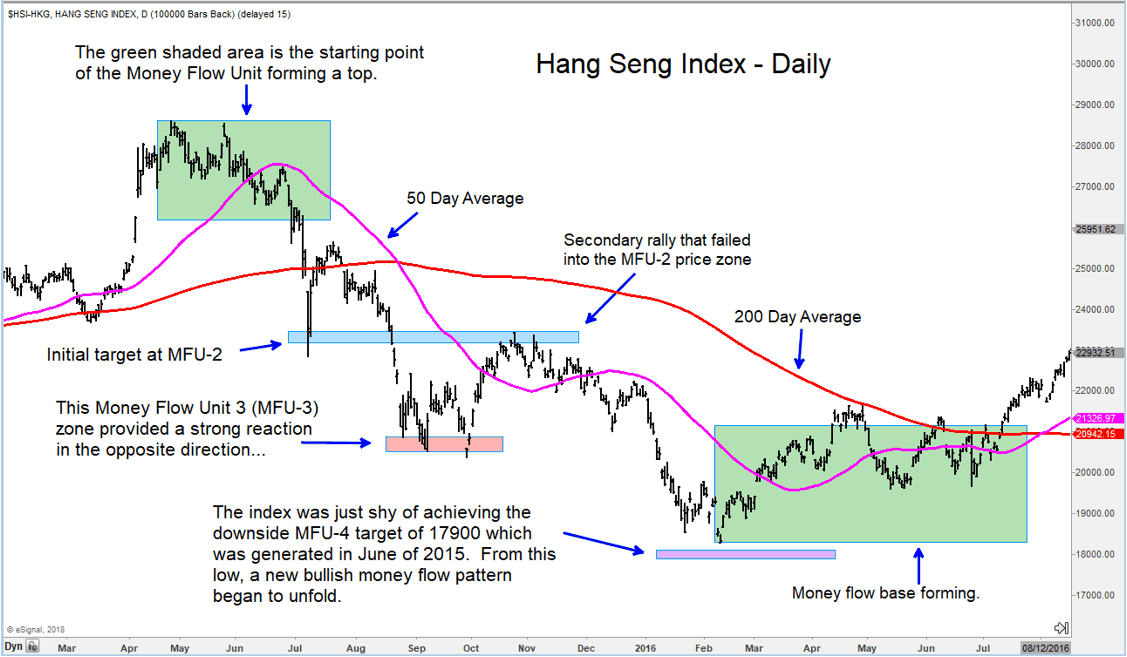
The chart below is a real-time analysis made in June 2015 of the Hang Seng Index. Once the top started to develop, the bearish money flow unit was identified and triggered by the end of June and the three downside targets identified. Note the strong counter-trend moves at the MFU-2 and MFU-3 areas. The index was shy of achieving the MFU-4 target of 17900 in February of 2016, and this is where the bottoming process began. By July of 2016, a money flow base was identified, and the upside targets were generated.
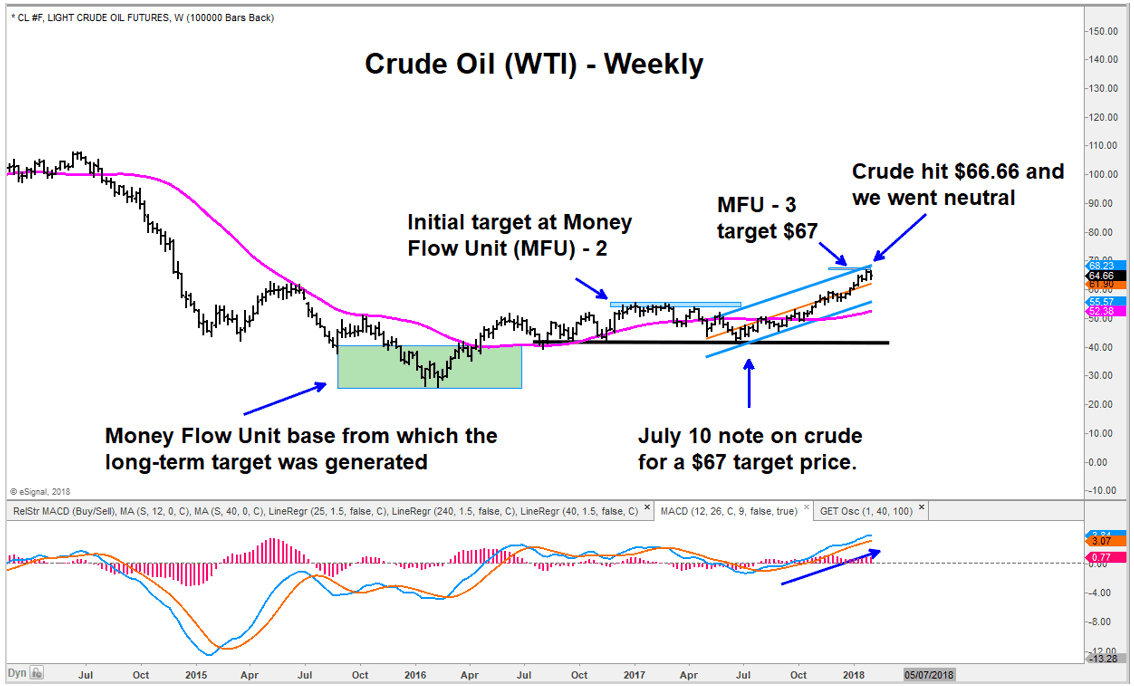
As an example of how the Money Flow Unit analysis works in identifying an emerging theme, we will use our “Long Crude Oil” call we went out with on July 10th of 2017 when WTI was trading at $44/barrel. Once the Money Flow Base was determined, the upside targets were generated. We then started screening and ranking emerging stock ideas within the energy sector. Our call was to get long crude for an upside target of $67. We went neutral at the end of January 2018 when crude hit $66.66. That chart of WTI from the July report is below, as well as the chart showing where we went neutral.
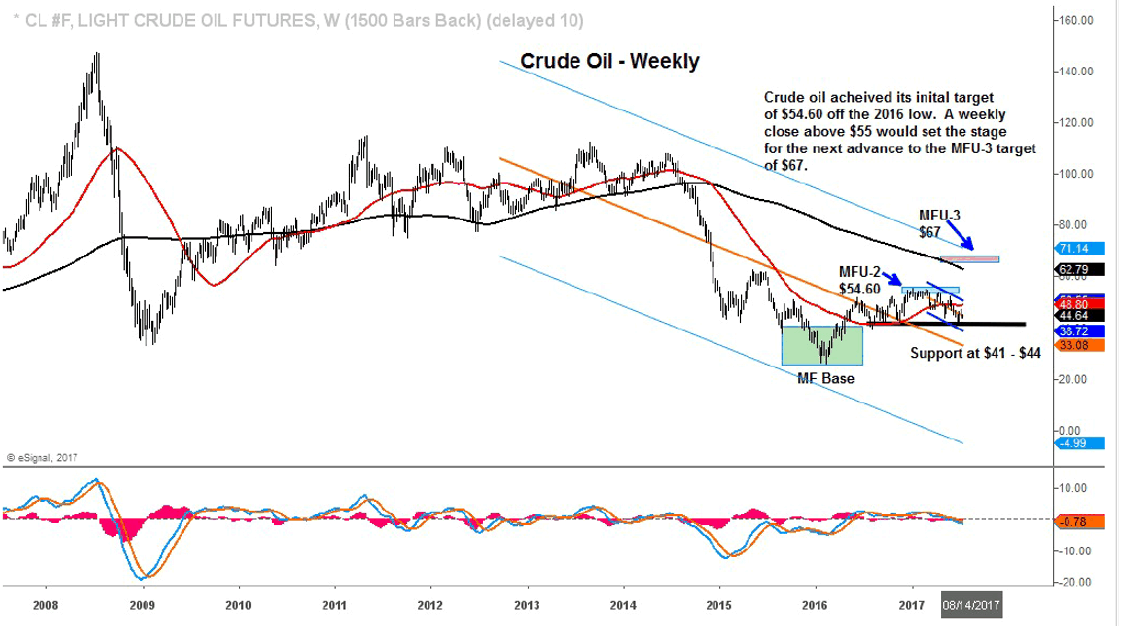
Chart used in our January 2018 report when we went neutral:
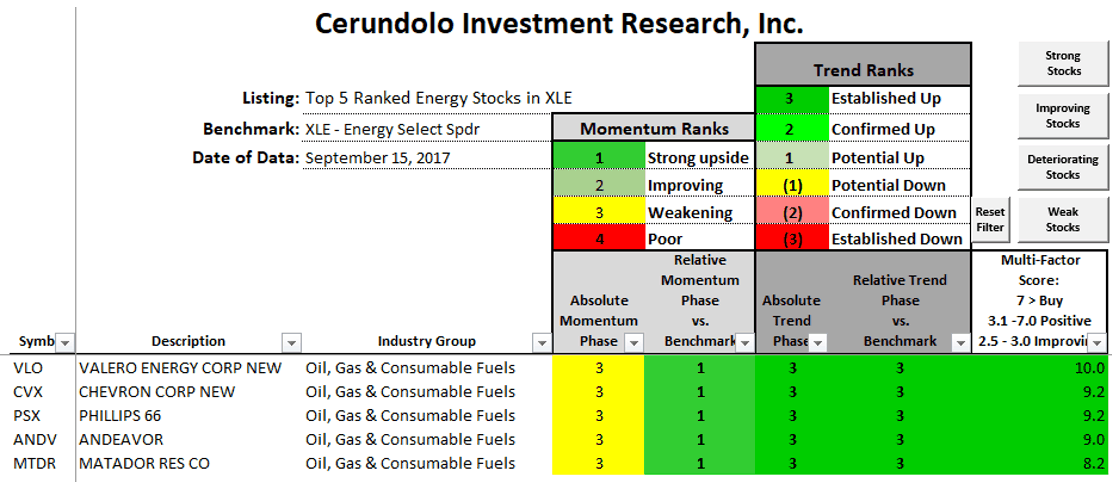
The table below is a snapshot of the top 5 ranked energy stocks in the XLE – Energy Select Spider on September 15, 2017, which we used to recommend long ideas to investors. This same process is used for all our global equity rankings across all sectors and industry groups. We use this multi-factor ranking model to assist benchmark-oriented portfolio managers in highlighting improving stocks within their investable universe that they should be paying attention to and what to avoid.
The Money Flow Unit analysis is mainly done for intermediate to long-term reviews on market indices, currencies, commodities, and fixed income. In addition, it can also be applied for sector, industry group, and individual equities. Once we have determined which sectors and industry groups are under accumulation or distribution using the Money Flow Unit analysis, we then cull out the longs or shorts using our proprietary multi-factor stock ranking model. This model was developed over decades of work analyzing thousands of securities on multiple timeframes and addressing the needs of portfolio managers, analyst, and traders of multibillion-dollar portfolios and hedge funds. To highlight some of the factor inputs, we look at absolute and relative performance to a benchmark, and this is measured on a trend and momentum basis. A secondary money flow analysis is used to help indicate accumulation or distribution taking place.
As the theme develops and the list of long and short ideas grows because of capital flows, our ranking model helps find the strongest/weakest stocks in that group. For a long only manager, one would execute on the top decile ranked stocks for those exhibiting solid factors. The middle tier of the ranking can help in determining emerging long candidates within an emerging theme. A long/short manager will use the ranking to either pair off the top and bottom deciles to create pair-trade ideas or focus on the bottom decile for the weakest names in the group as shorts.
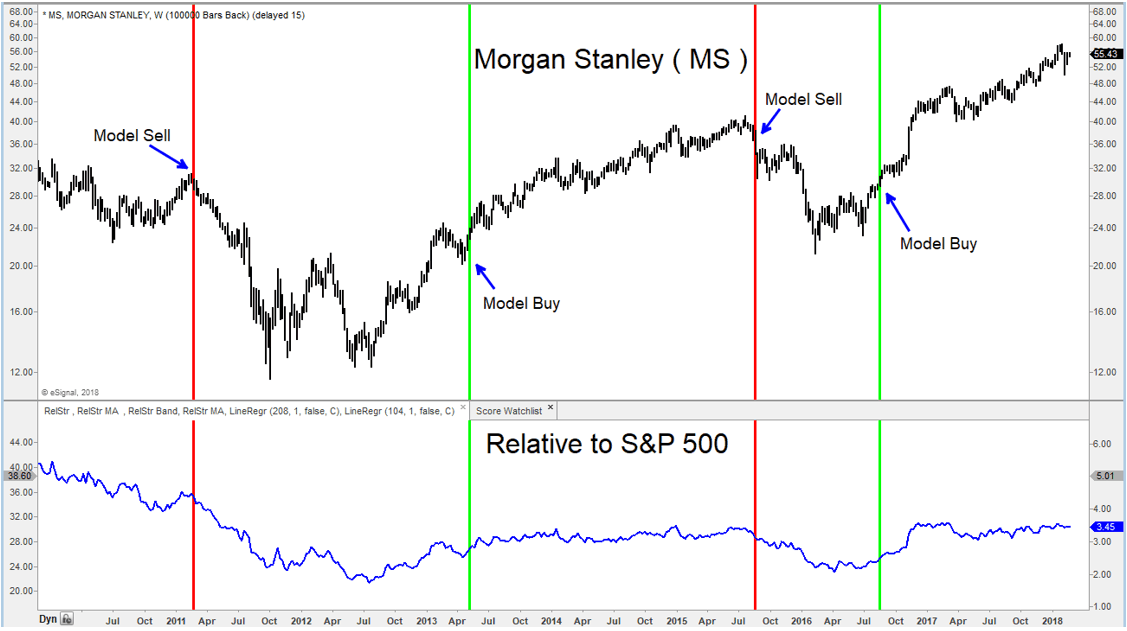
The eight-year chart of Morgan Stanley below, helps illustrate the buy and sell signals that the model generated. As a systematic and standalone process, a close above or below a model score will signal the buy or sell. When we review individual securities, we will also use absolute and relative trendline breaks as confirmation. Our intention is to capture and maintain a good absolute and relative trend.
On a weekly basis we publish the “Technical Tuesday Report” where we provide analysis on specific regions, indices, sectors, commodities, currencies and fixed income that we believe investors should be focusing their fundamental analysis. This research will drive other reports where we hone in on specific investable ideas at the global region level as well as sector and industry group. This report will often be the catalyst from which we publish reports on a specific country or sector and we further publish independent reports on currencies and commodities.
We also provide rankings of a sector, industry group or on a benchmark as well as custom portfolio reviews relative to a benchmark in a spreadsheet and chart format. All rankings are based on a four to six-month lookback to define the absolute and relative trends, which helps to eliminate the short-term noise.
Please let us know if you are interested in these reports.


