Search the Site
US Markets - SMH Review - December 12, 2017
US Markets Update
Volume 1, Issue 3
December 12, 2017
Download PDF Version here
Items of Interest:
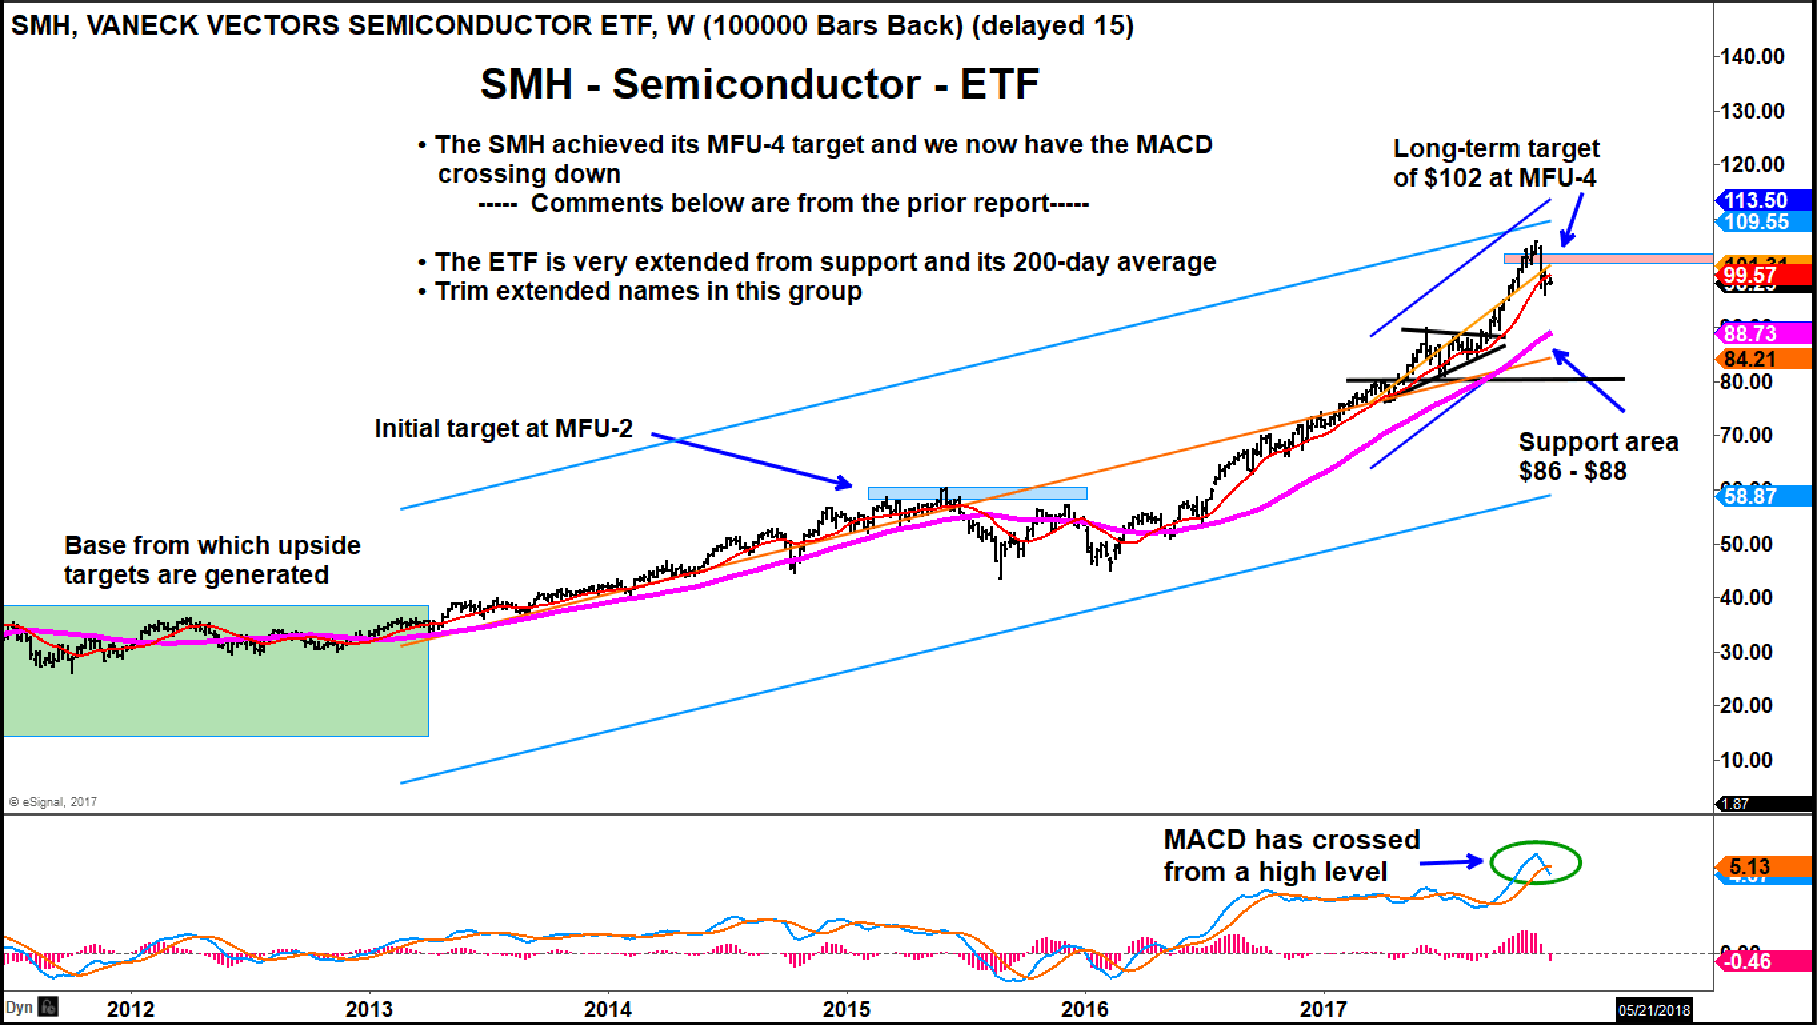
- Semis continue to work off their recent “spike highs” after hitting the MFU-4 target of $104 on the SMH.
- The chart of the SMH which we have been showing in our “Technical Tuesday” reports, and it helps illustrate the strong rally into the target zone. We now a negative cross on the weekly MACD momentum indicator.
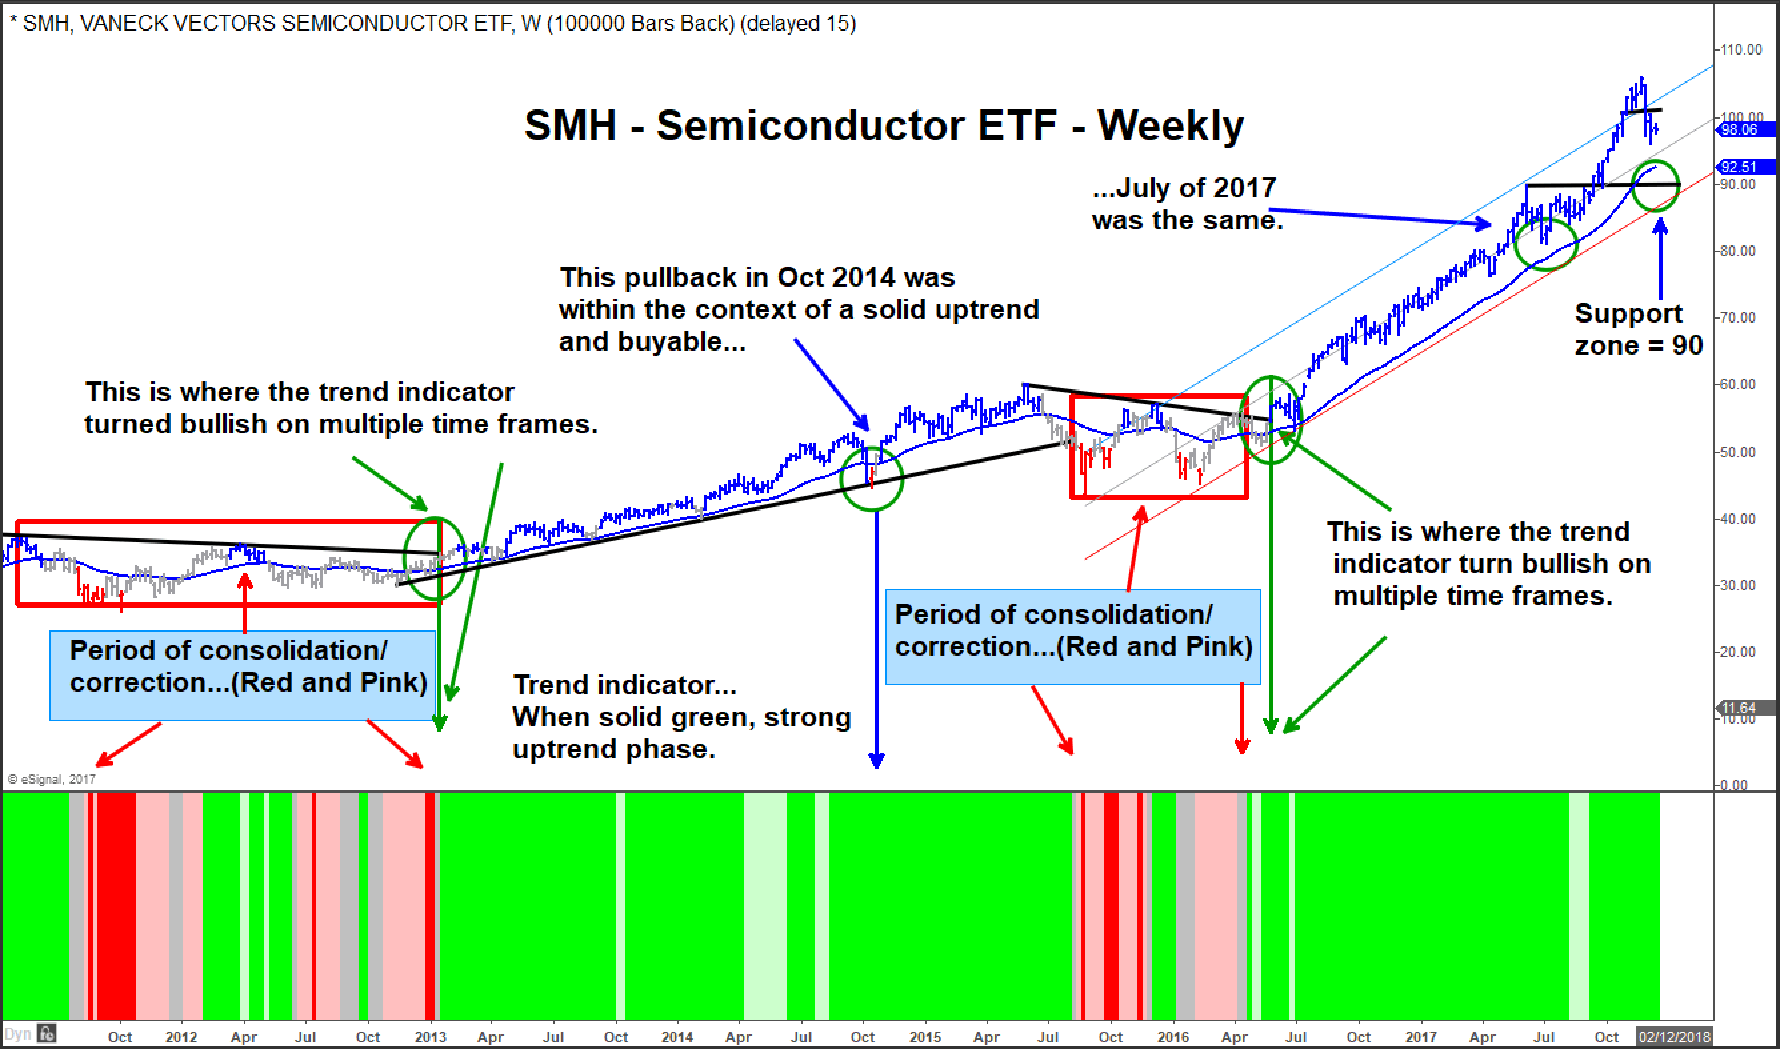
- We show our proprietary long-term trend model that helps illustrate periods where the SMH goes from positive trend to that of a “consolidation/correction” phase. As of now, the long-term trend is intact, but we are correcting on the smaller daily time frame.
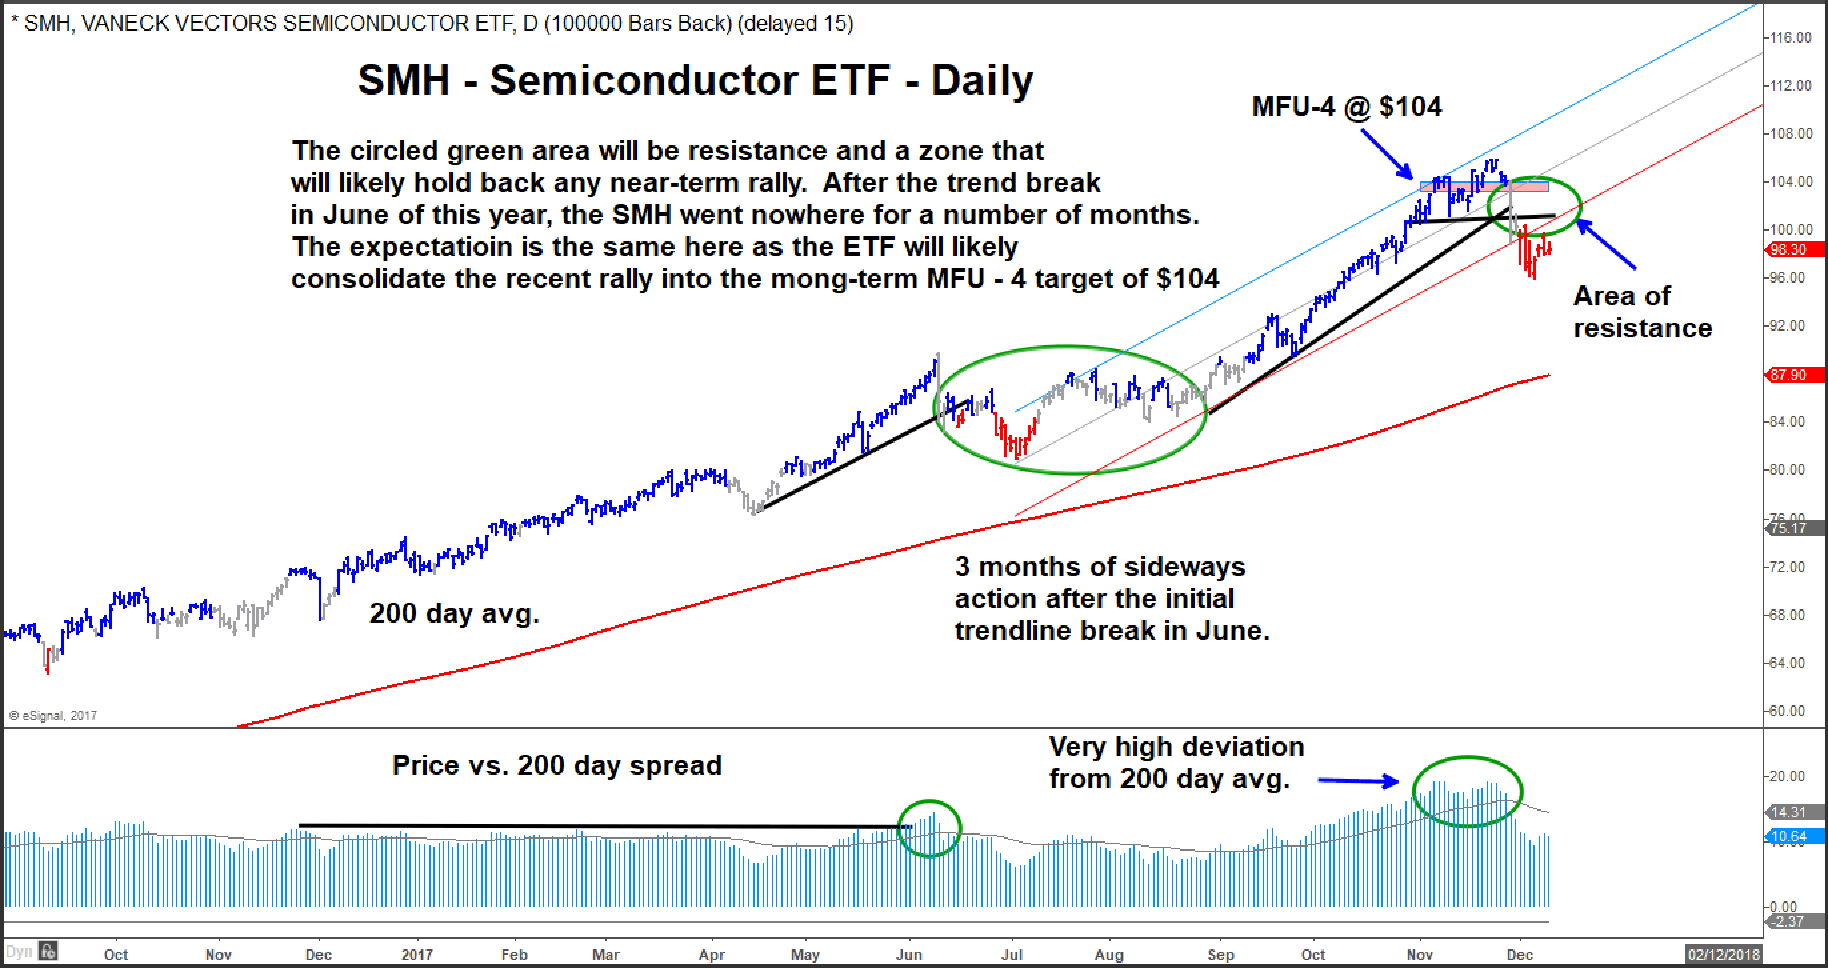
- The daily chart of the SMH illustrates the strong deviation from the 200 day average and the recent break below an important regression trend channel.
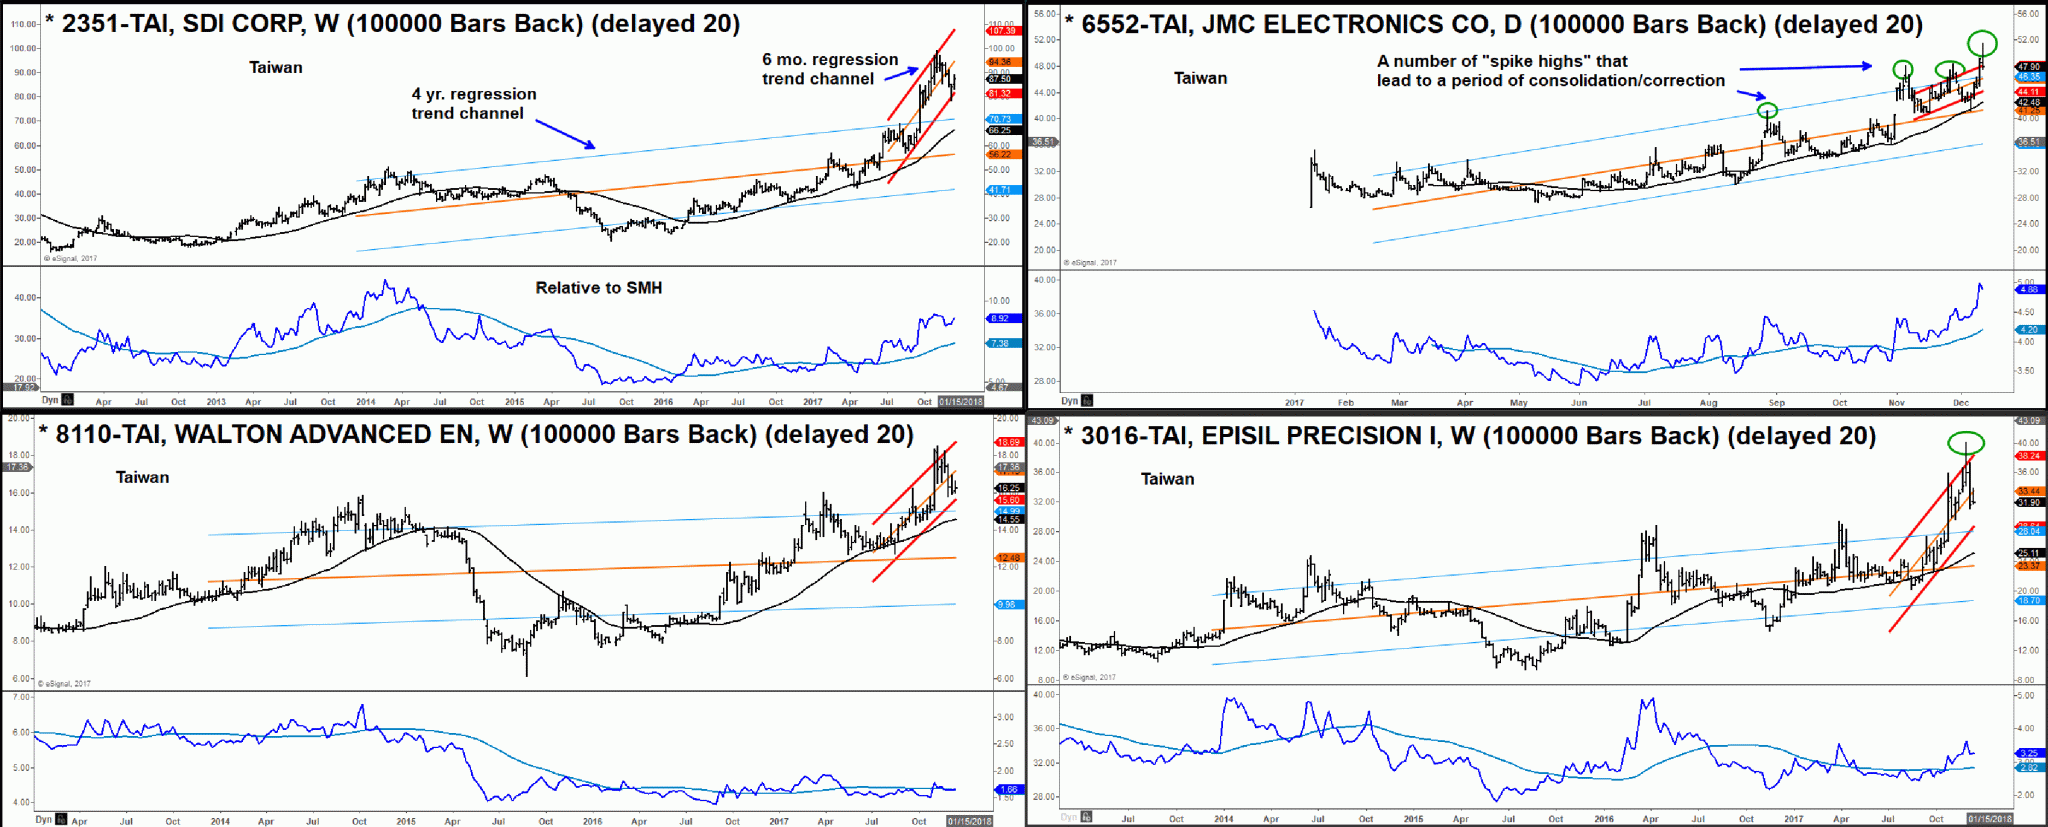
- We highlight some of the top ranked semis in the SMH as well as some in Japan, Taiwan and Europe. The message is consistent across continents, expect more near-term weakness as these stocks consolidate/correct the rally we had this year.
MFU – refers to Money Flow Units, a proprietary model which projects important potential inflection points on all timeframes into the future. Typically, MFU-2 are zones where shallow pullbacks occur, while MFU-3 and 4 zones are areas where we can have a deeper correction and consolidation. Depending on various market momentum characteristics, the MFU-3 or MFU-4 zones often indicate a termination of the previous trend. If momentum is very strong, these zones will morph into larger price objectives and will be highlighted accordingly.
The proprietary trend indicator below helps illustrate periods of when the internals of a “strong trend” are present, strong green, and where you want to buy a pullback into support. October of 2014 and July of this year are good examples of that and we are far from support at this point in time. The periods in red are where the indicator flips to consolidation or negative trend.
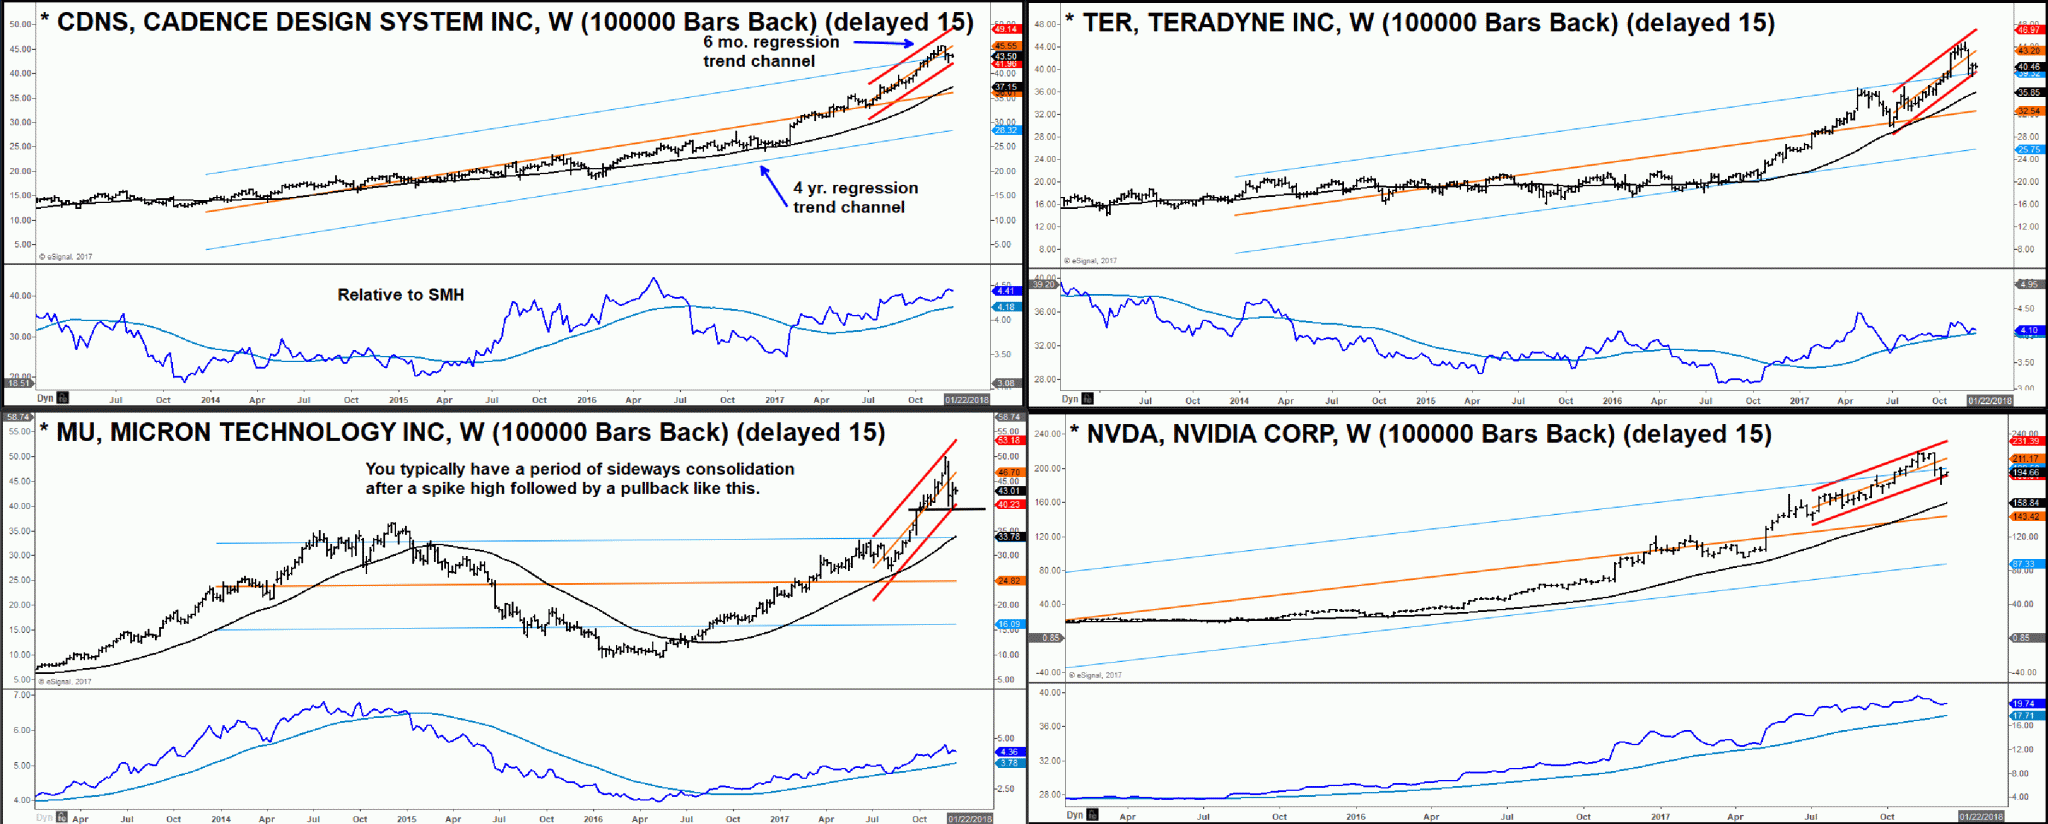
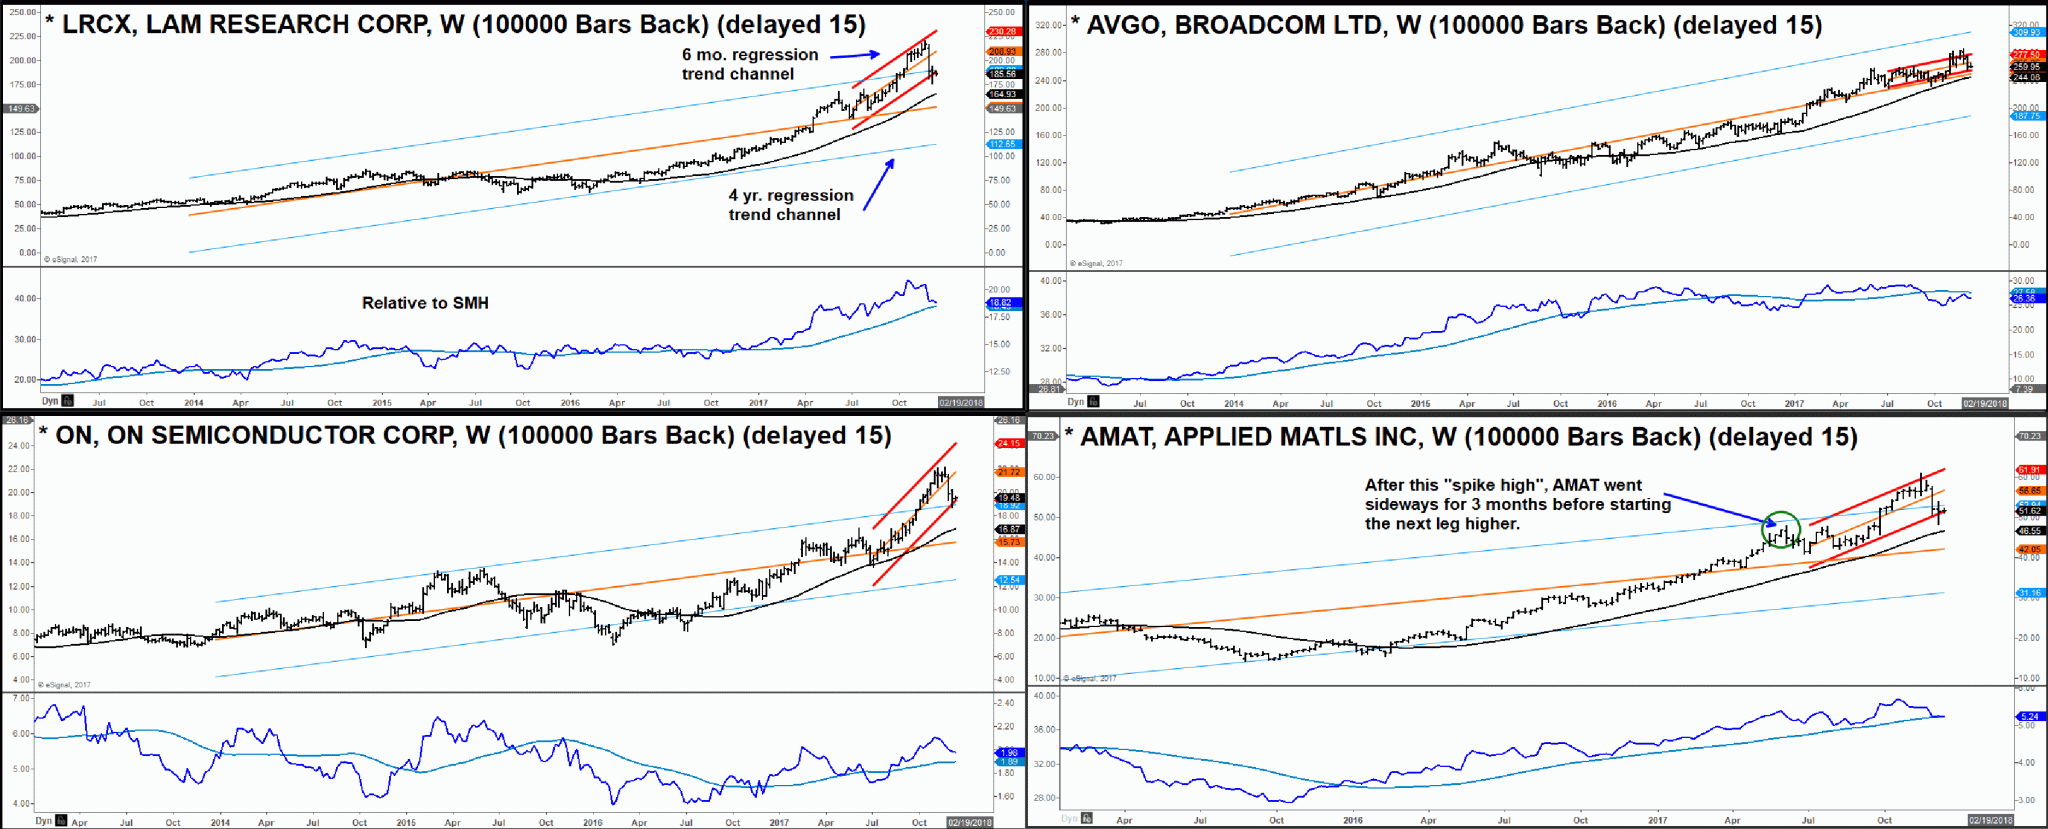
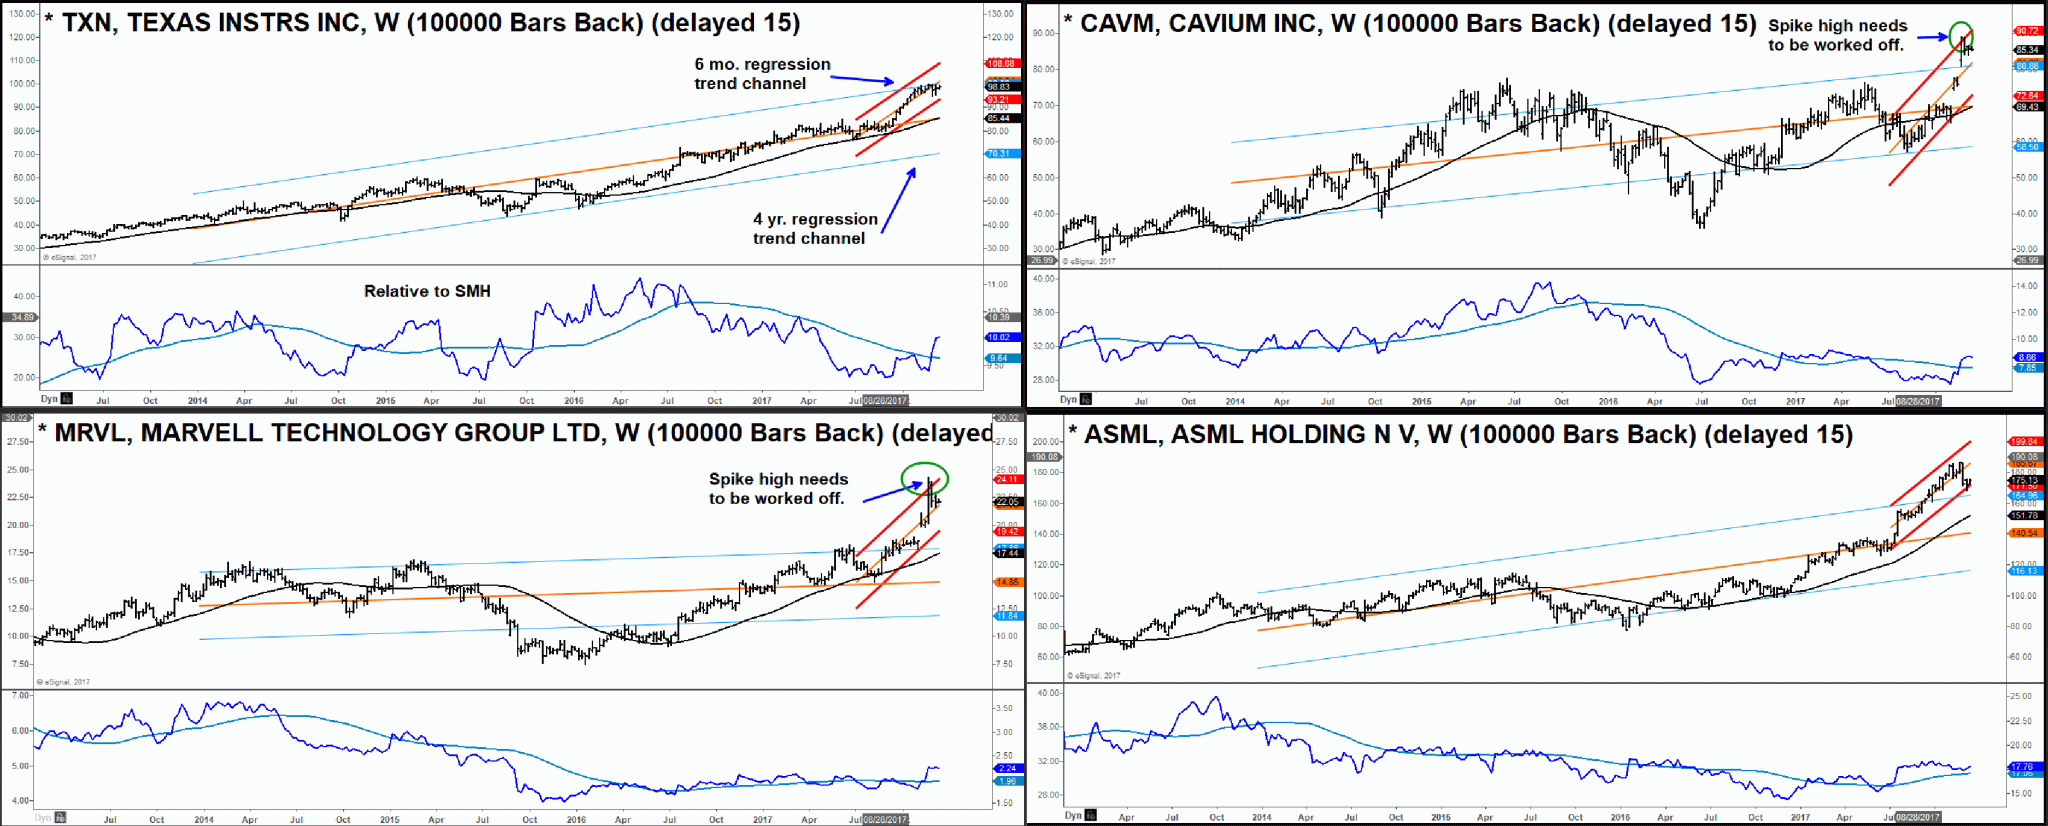
The following charts contain the top ranked stocks in the SMH. As you will see, the long-term trends are favorable as indicated by the regression trend channels, we need to see prices consolidate the recent spike highs.
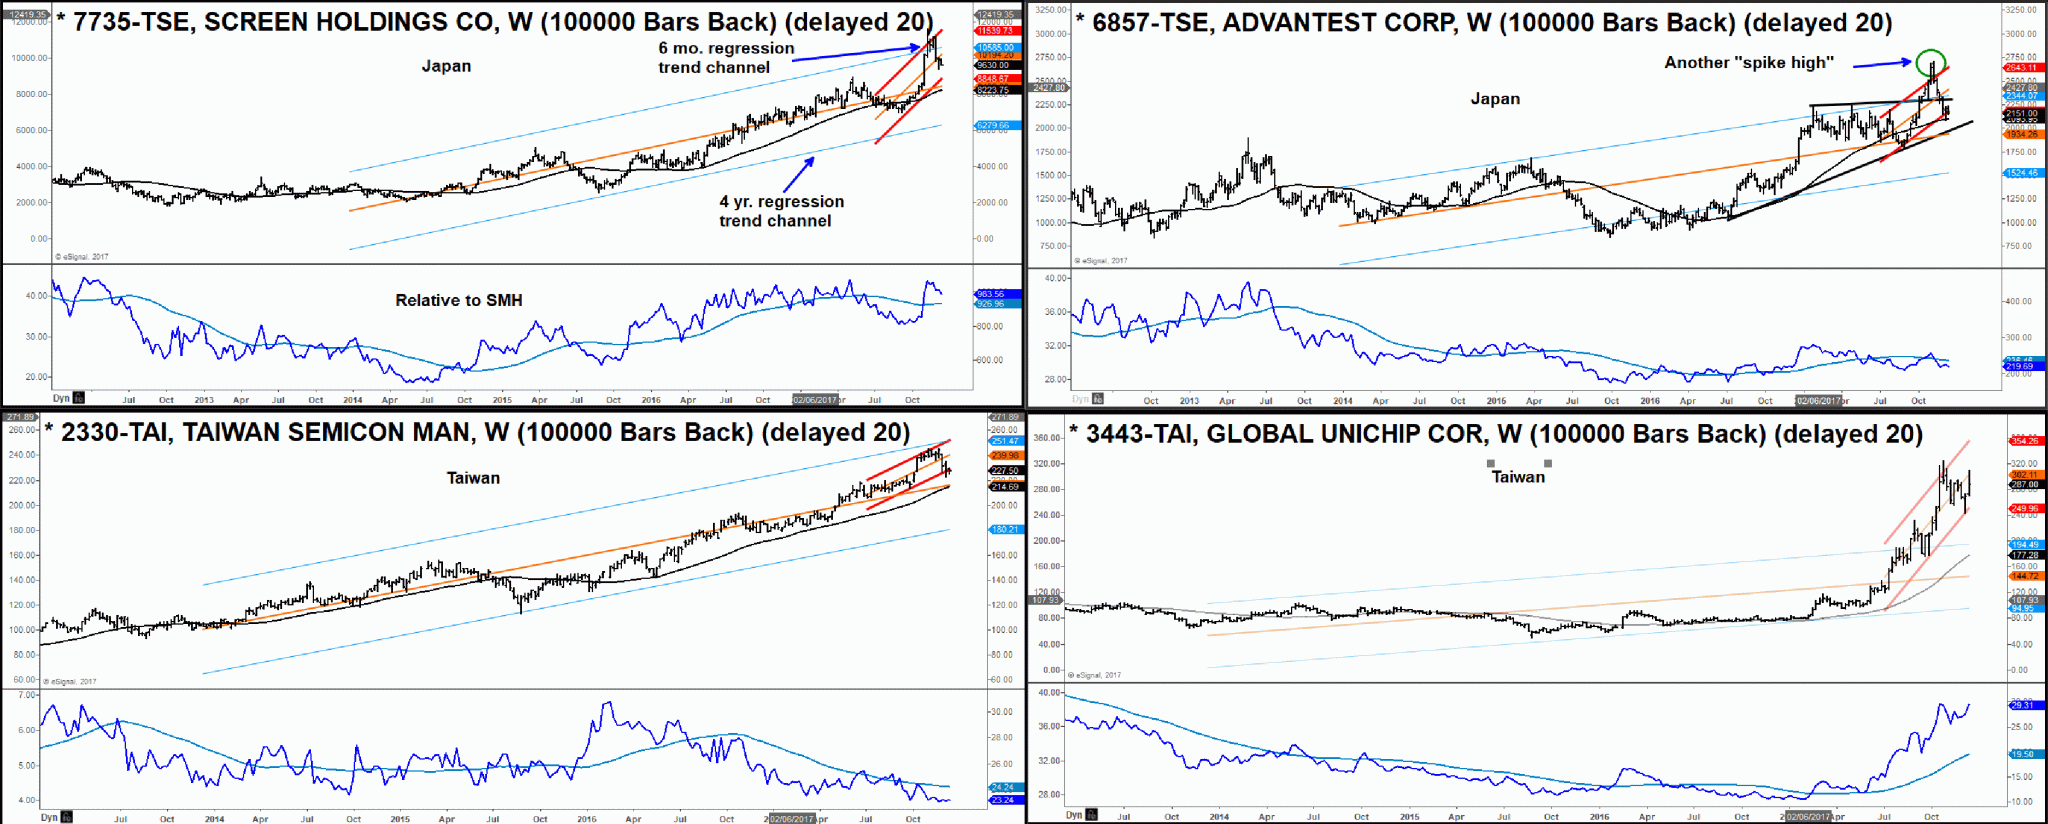
Here are some of the top ranked Semis in Japan and Taiwan
A few more Taiwan companies that have also started to correct the recent “spike highs”.
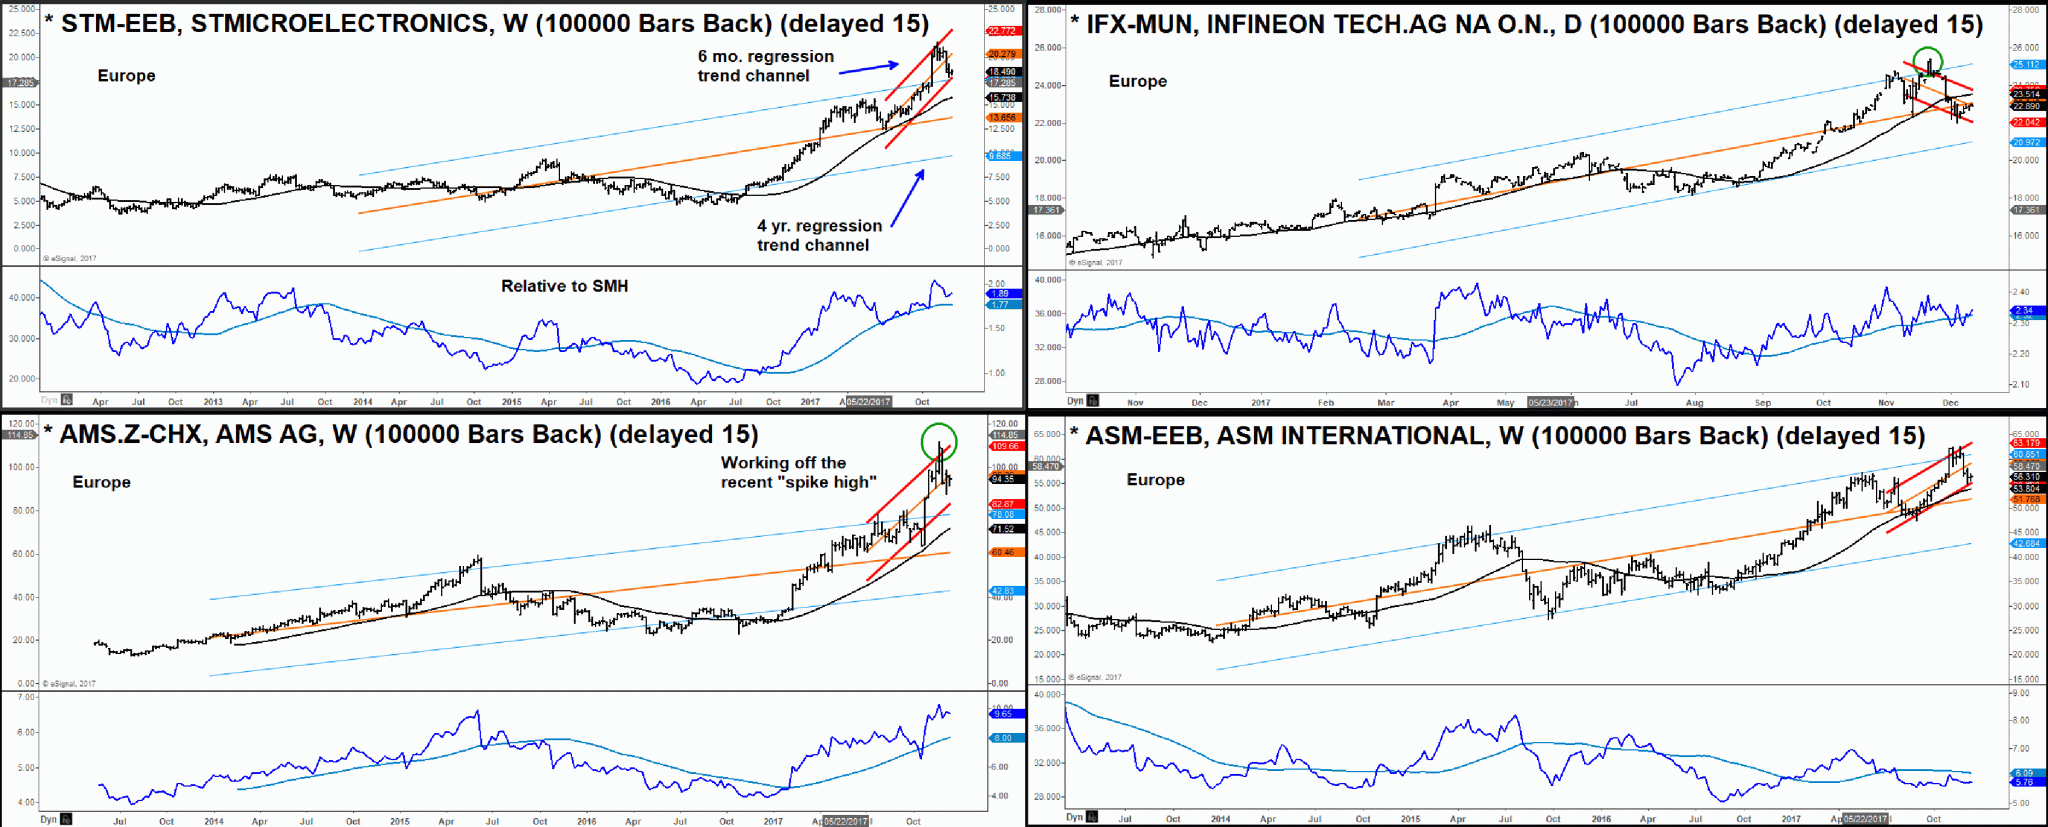
In Europe as well, we see these stocks working off their recent “spike highs”. Too early to jump back in.
SMH, CDNS TER MU NVDA LRCX AVGO ON AMAT TXN CAVM MRVL ASML Screen Holdings, Advantest, Taiwan Semicon, Global Unichip, SDI, JMC, Walton Advanced, Episil Precision, STMicro, Infineon, AMS, ASM,


